
By: Rolla Hassan Ph.D
Introduction
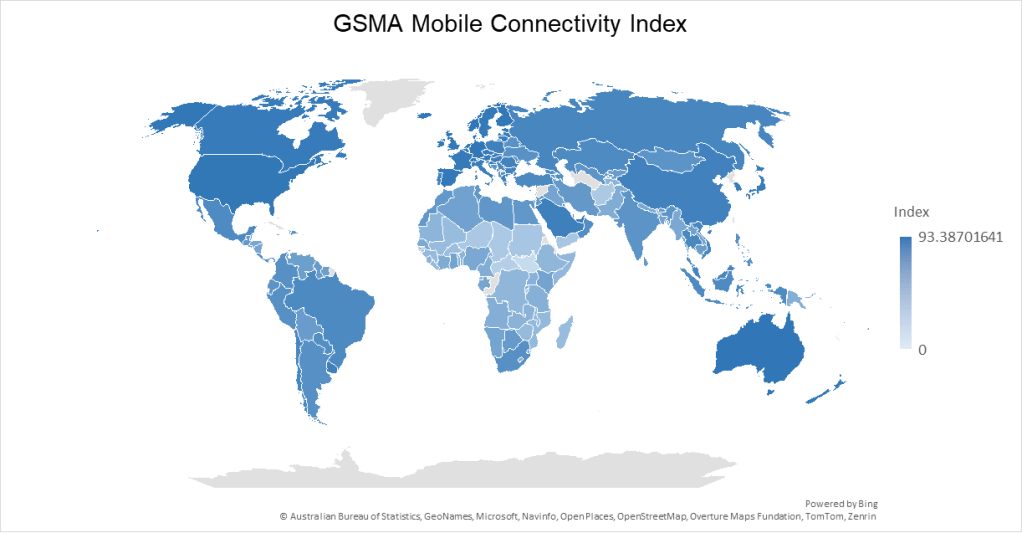
In an increasingly interconnected world, mobile internet access has transitioned from a luxury to a fundamental catalyst for social and economic development. The ability to connect to the internet via a mobile device unlocks opportunities in education, finance, healthcare, and commerce, offering a lifeline to a better future for billions. The GSMA’s Mobile Connectivity Index (MCI) provides a comprehensive framework for understanding the landscape of mobile internet adoption, measuring the performance of 173 countries against the core enablers of connectivity.
This article presents a detailed analysis based on the GSMA 2025 MCI data, with a particular focus on the correlation between its various components. By examining the statistical relationships between the enablers of mobile connectivity, we can identify the most critical drivers and the most stubborn barriers. This analysis, supplemented by recent industry research, offers a clearer picture of not just who is connected, but why and how. We will explore the four pillars of connectivity, dissect the statistical drivers of the overall Index, investigate the persistent digital divide, and quantify the profound economic impact of closing this gap. The result is a set of strategic insights for policymakers, industry leaders, and development organizations working to build a more inclusive digital future.
The Four Pillars of Mobile Connectivity
The Mobile Connectivity Index is built upon four foundational enablers, each representing a critical dimension of the ecosystem required for widespread mobile internet adoption. A country must perform well across all four pillars to create a truly enabling environment for its citizens.
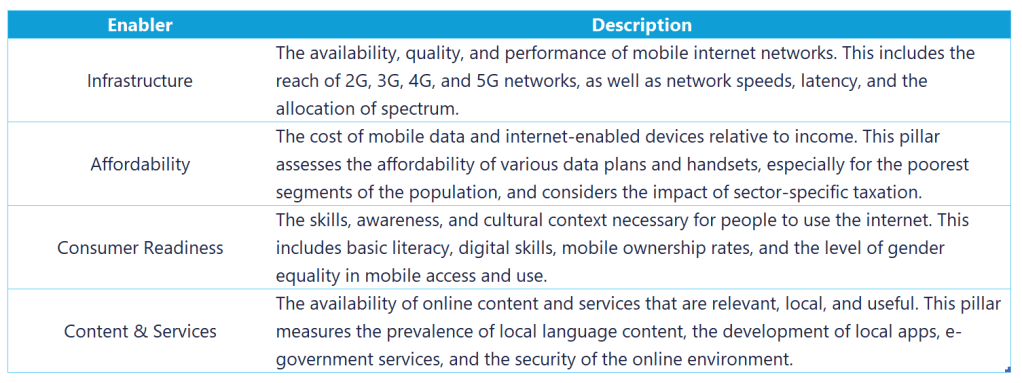
A Deep Dive into the Drivers: Correlation Analysis
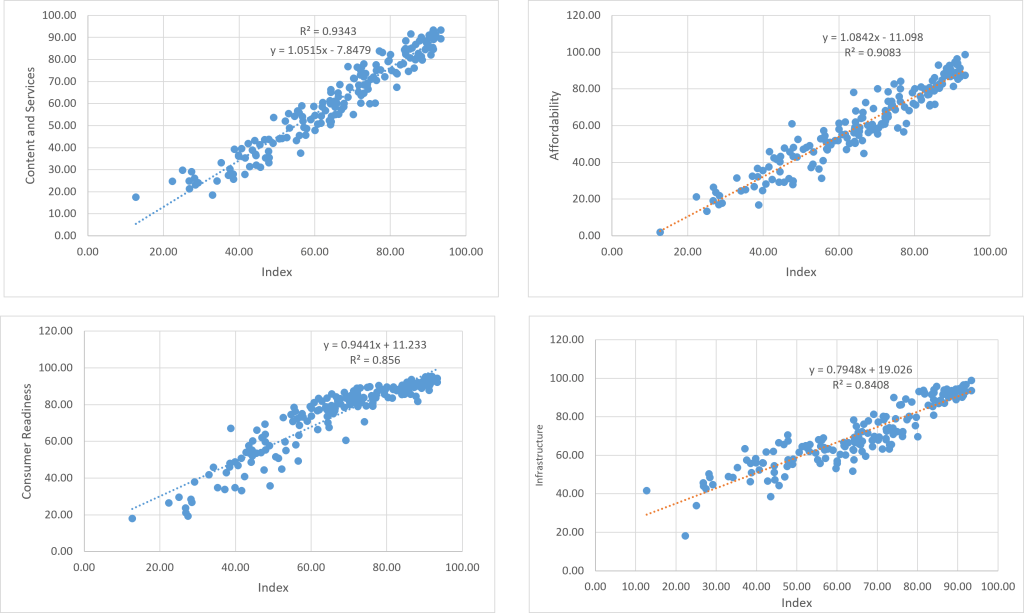
To understand which of these pillars has the greatest impact on overall mobile connectivity, we conducted a correlation analysis on the MCI dataset. The results reveal a clear hierarchy of influence, offering powerful insights into where efforts and investments can be most effective.
Our analysis shows that while all enablers are important, they are not all created equal in their predictive power. The table below shows the factors that correlate most strongly with a country’s overall Mobile Connectivity Index score.
Digital Inclusion Correlation MatrixDigital Inclusion Correlation Matrix
Legend: Strong Negative No Correlation Strong Positive
| Variables | Index | Infrastructure | Affordability | Consumer | Content | Coverage | Performance | Spectrum | Mobile Data | Handset |
|---|---|---|---|---|---|---|---|---|---|---|
| Index | 1.000 | 0.917 | 0.953 | 0.925 | 0.967 | 0.846 | 0.886 | 0.662 | 0.888 | 0.886 |
| Infrastructure | 0.917 | 1.000 | 0.835 | 0.785 | 0.878 | 0.882 | 0.955 | 0.784 | 0.801 | 0.779 |
| Affordability | 0.953 | 0.835 | 1.000 | 0.835 | 0.885 | 0.767 | 0.813 | 0.593 | 0.886 | 0.932 |
| Consumer | 0.925 | 0.785 | 0.835 | 1.000 | 0.874 | 0.781 | 0.763 | 0.501 | 0.771 | 0.768 |
| Content | 0.967 | 0.878 | 0.885 | 0.874 | 1.000 | 0.790 | 0.846 | 0.660 | 0.858 | 0.833 |
| Coverage | 0.846 | 0.882 | 0.767 | 0.781 | 0.790 | 1.000 | 0.846 | 0.660 | 0.430 | 0.430 |
| Performance | 0.886 | 0.955 | 0.813 | 0.763 | 0.846 | 0.846 | 1.000 | 0.625 | 0.230 | 0.300 |
Key Findings: Strong positive correlations between Index and Content (0.967), Index and Affordability (0.953), and Infrastructure and Performance (0.955). This suggests these digital inclusion metrics are highly interconnected.
Strikingly, Content and Services emerges as the single most powerful driver of mobile connectivity. This suggests that the availability of relevant, engaging, and useful content is the primary magnet drawing people online. Closely following is Affordability, underscoring the critical role of cost as a gateway or barrier to access. It is also noteworthy that Infrastructure, while essential, is the least correlated of the main enablers. This does not diminish its importance, but rather suggests that simply building networks is not enough; they must be affordable, and there must be a compelling reason for people to use them.
Furthermore, the analysis reveals strong interdependencies between the enablers. For instance, Content & Services has a high correlation with Consumer Readiness (0.8736), indicating that a population with higher digital skills and awareness is better able to engage with and drive demand for relevant content. Similarly, the strong link between Affordability and Infrastructure (0.8348) highlights the symbiotic relationship between network investment and the pricing of services.
The Economic Engine of Connectivity
The imperative to close the digital divide is not just a matter of social equity; it is a matter of profound economic importance. A wealth of research demonstrates a direct causal link between mobile broadband adoption and economic growth.
A landmark study by Ericsson, analyzing data from 135 countries, found that a 10% increase in mobile broadband adoption causes an initial 0.8% increase in GDP.
This effect is most pronounced in the early years after the technology’s introduction. The GSMA estimates that mobile technologies and services already contribute approximately 5.8% of global GDP, equivalent to $6.5 trillion in economic value.
Looking forward, the economic prize for closing the usage gap is immense. The GSMA calculates that connecting the 3.1 billion people who have coverage but are not yet online would generate an additional $3.5 trillion in GDP between 2023 and 2030, with 90% of this benefit flowing to low- and middle-income countries.
Strategic Implications for a Connected Future
This analysis of the Mobile Connectivity Index, combined with broader industry research, points to several key strategic imperatives for stakeholders aiming to accelerate digital inclusion:
1.Adopt a Content-First Mindset: The data is unequivocal: content is king. Investment in developing local, relevant, and multilingual content and services is likely to yield the highest returns in driving mobile internet adoption. This means supporting local app developers, digitizing government services, and fostering local digital media.
2.Tackle Affordability Holistically: Affordability is a two-pronged challenge. Our analysis shows that Handset Affordability (0.9317 correlation with the Affordability enabler) is even more critical than Mobile Data Affordability (0.8857). Strategies must address both the cost of devices and the cost of data plans, potentially through innovative financing models, smart subsidies, or reducing sector-specific taxes, even though taxation showed a weaker direct correlation with the overall index.
3.Shift from Coverage to Quality: With the coverage gap shrinking, the focus must shift from simply expanding network footprints to enhancing network performance. The correlation analysis shows that Network Performance (0.9549 correlation with the Infrastructure enabler) is a much stronger driver of a successful infrastructure pillar than Spectrum allocation (0.7843) or legacy network coverage.
4.Invest in People, Not Just Poles: The high correlation of Consumer Readiness and its components—Mobile Ownership (0.9228), Basic Skills (0.9222), and Gender Equality (0.9220)—underscores that the human dimension is as important as the technological one. Digital literacy programs, initiatives to close the gender gap in mobile ownership, and basic education are fundamental prerequisites for a thriving digital society.
Conclusion
The journey to universal mobile connectivity is at a critical juncture. The era of rapid, organic growth is giving way to a more challenging phase that requires a nuanced, data-driven approach. Our analysis of the Mobile Connectivity Index reveals that the path forward lies not just in laying fiber and erecting towers, but in building a vibrant ecosystem of affordable devices, relevant content, and skilled users.
The strongest drivers of connectivity are no longer purely technical; they are economic and social. By focusing on a content-first strategy, tackling the dual affordability crisis of handsets and data, investing in digital literacy, and ensuring equitable access for all, the global community can unlock the immense social and economic potential of the mobile internet and build a more inclusive and prosperous digital future for all.
References
GSMA. (2025). Mobile Connectivity Index. Retrieved from https://www.mobileconnectivityindex.com
GSMA. (2024, October 23). New GSMA report shows mobile internet connectivity continues to grow globally but barriers for 3.45 billion unconnected people remain. Retrieved from https://www.gsma.com/newsroom/press-release/new-gsma-report-shows-mobile-internet-connectivity-continues-to-grow-globally-but-barriers-for-3-45-billion-unconnected-people-remain/
Ericsson. (n.d.). Mobile broadband drives economic development. Retrieved from https://www.ericsson.com/en/reports-and-papers/research-papers/research-brief-mobile-broadband-drives-economic-development
GSMA. (2025). The Mobile Economy 2025. Retrieved from https://www.gsma.com/solutions-and-impact/connectivity-for-good/mobile-economy/


Leave a comment